Figures & Tables — second-review surface (v8)
manuscript v8의 Figure 4개(이미지 포함)와 Table 2개를 한 곳에 모아 첨삭 전용 surface로 publish. 본문 manuscript은 propofol-stopwatch slug 참조.
첨삭 안내 — Hypothes.is는 텍스트에만 anchor 가능합니다 (이미지 픽셀에는 marker 불가). 이미지의 시각적 변경 의견(예: “Panel A 빨간 화살표가 너무 진하다”, “y축 눈금 0.1 단위로 더 촘촘하게”)은 해당 figure caption 또는 각 figure 아래의 *“시각 코멘트 anchor 영역”*에 첨삭해 주십시오.
라이브 비교:
- 현행 manuscript (v8): https://ybman.uk/manuscripts/propofol-stopwatch/
- v7 archive: https://ybman.uk/manuscripts/propofol-stopwatch-v7-archive/
Figure 1. The wall-mounted stopwatch installed in the endoscopy room
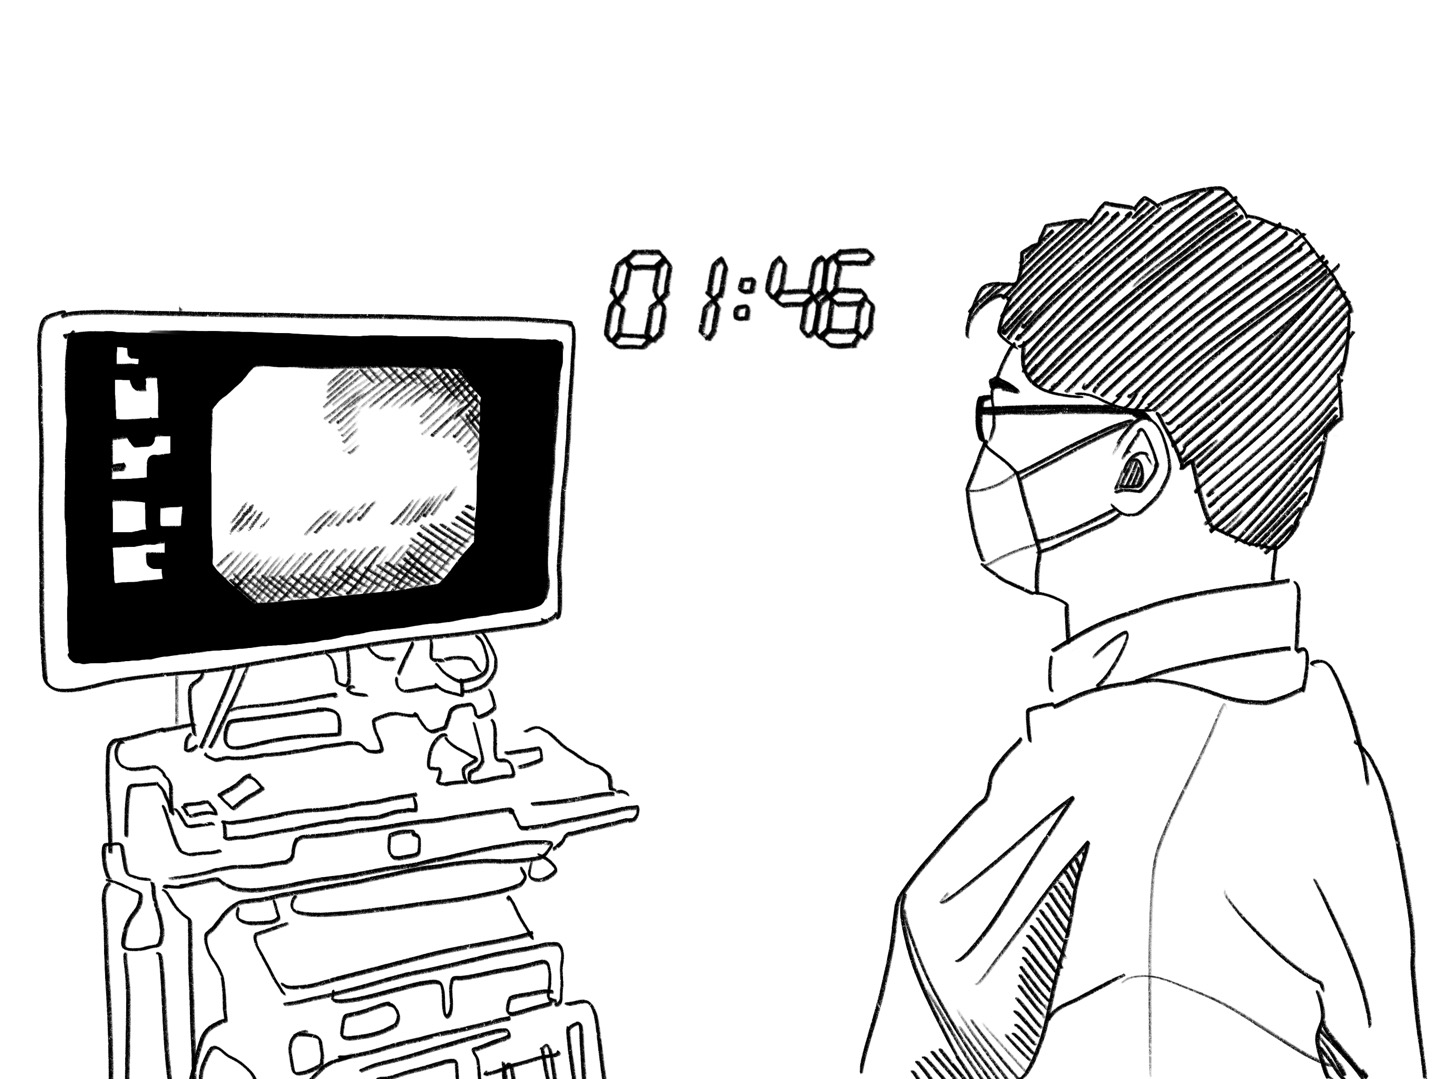
Caption. Line-drawing illustration of the wall-mounted digital LED stopwatch (centre, elapsed time 01:46) in the endoscopist’s direct visual field, beside an analogue reference clock; the endoscopy monitor is to the left. The stopwatch is started after the initial propofol bolus.
A blurred clinical-setting photograph of the same scene is provided as Supplementary Figure S3 for readers who wish to view the original installation.
(시각 코멘트 anchor 영역 — Figure 1 자체에 대한 시각 변경 의견)
Figure 2. Distribution of total propofol dose by sex and period (n = 1,371)
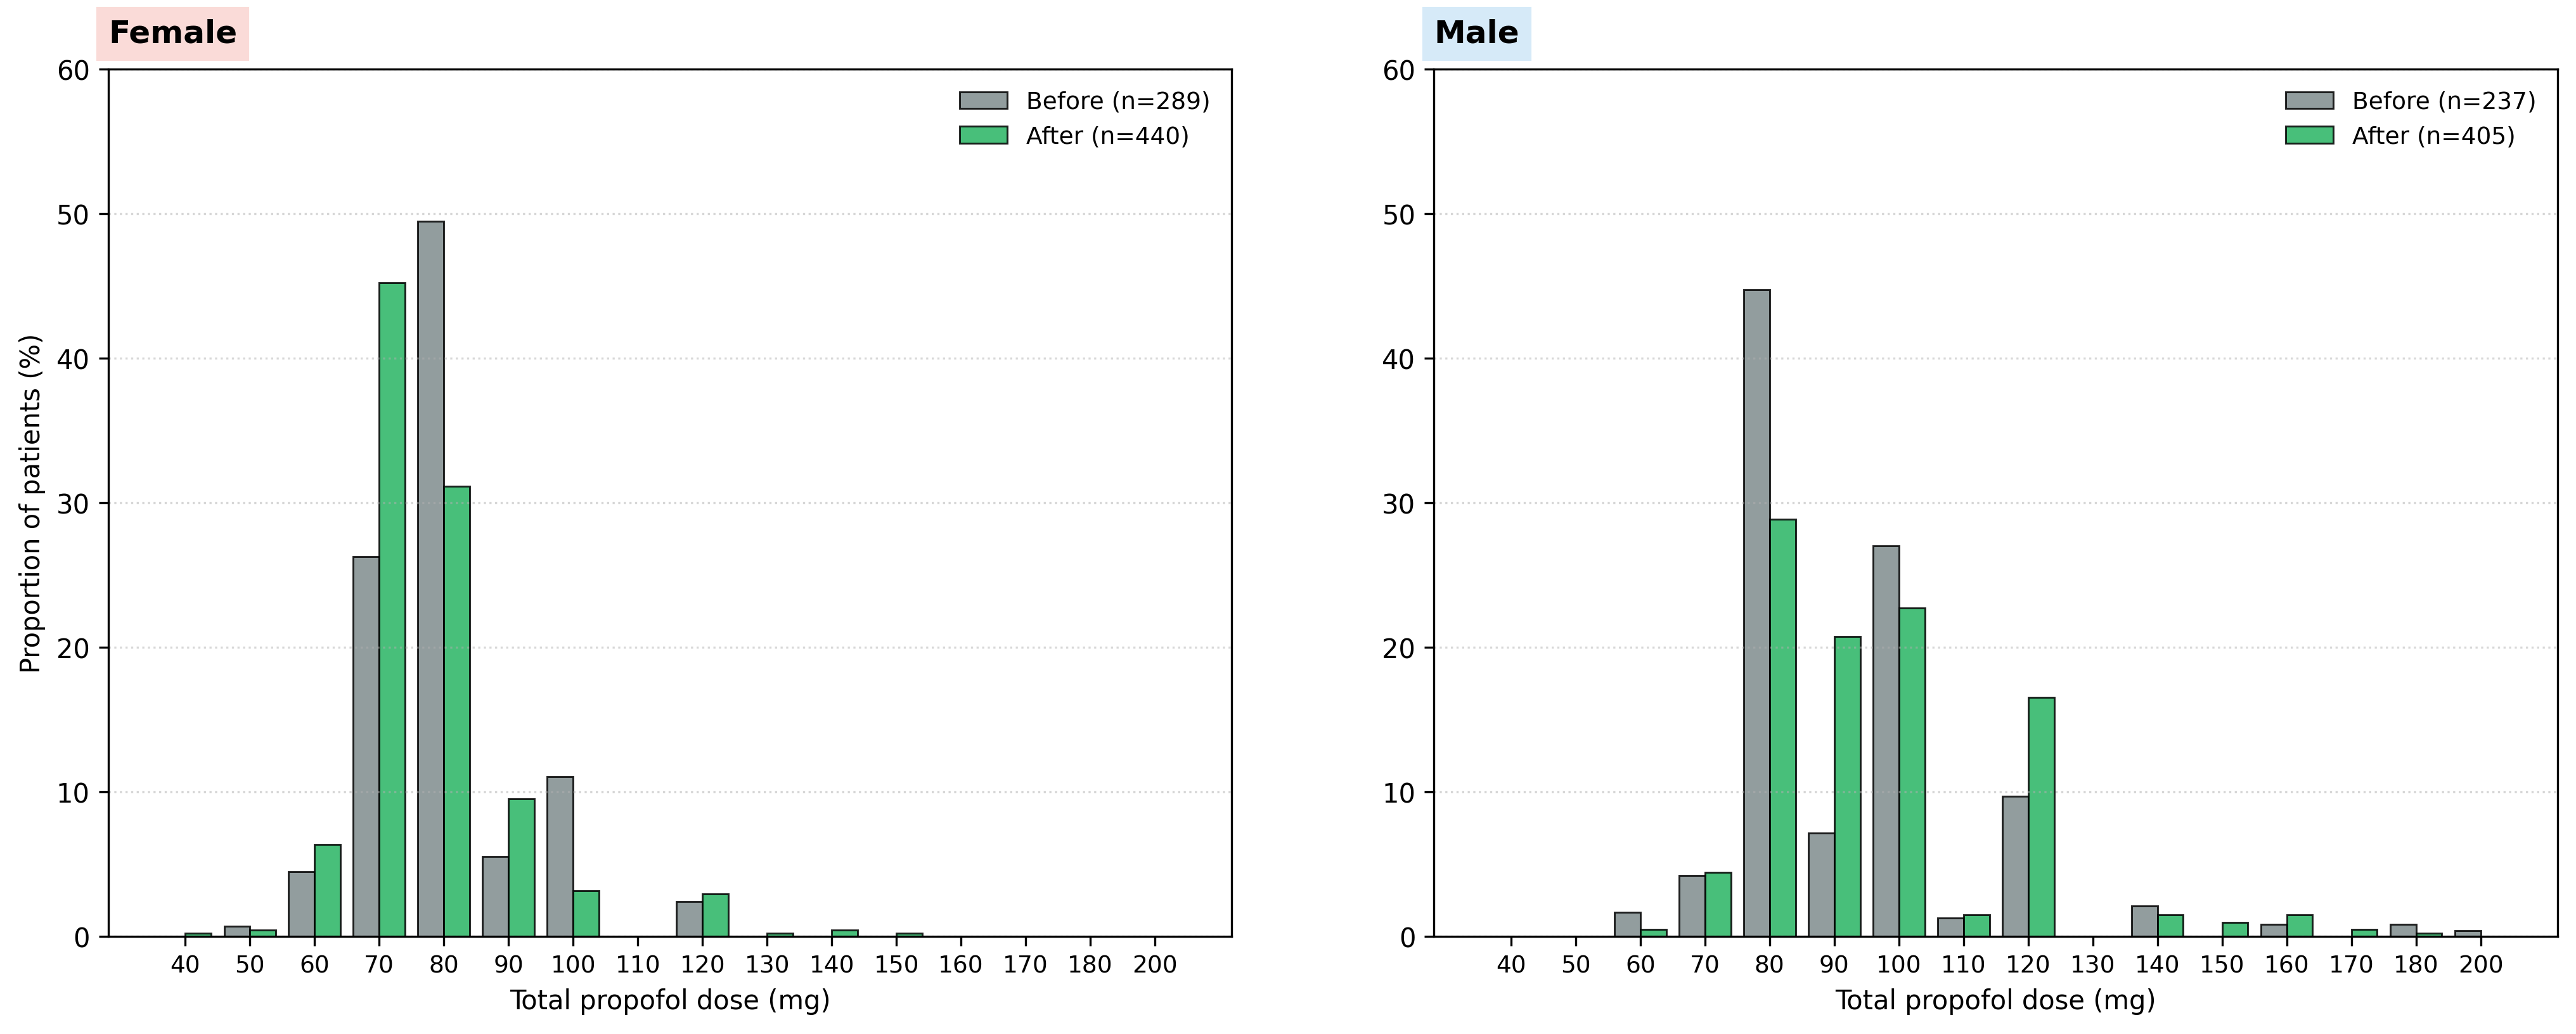
Caption (v8 — simplified). Proportion of patients receiving each discrete total-dose level, with Before and After bars overlaid. Female panel: median total dose 80 → 70 mg (p < 10⁻⁵). Male panel: median total dose 80 → 90 mg (p = 0.003). Two-proportion z-test p values for individual dose levels are in Supplement Table S0.
(변경 사항: figure 안 Δ +/- 라벨, p value 라벨, modal/median 텍스트, 오렌지 강조 영역, suptitle, footnote 모두 제거. caption에 z-test 결과 추가.)
(시각 코멘트 anchor 영역 — Figure 2 패널 색·축·라벨에 대한 의견)
Figure 3. Monthly run chart of weight-adjusted propofol dose (Before: Jan–May 2019; After: Jul–Oct 2019)
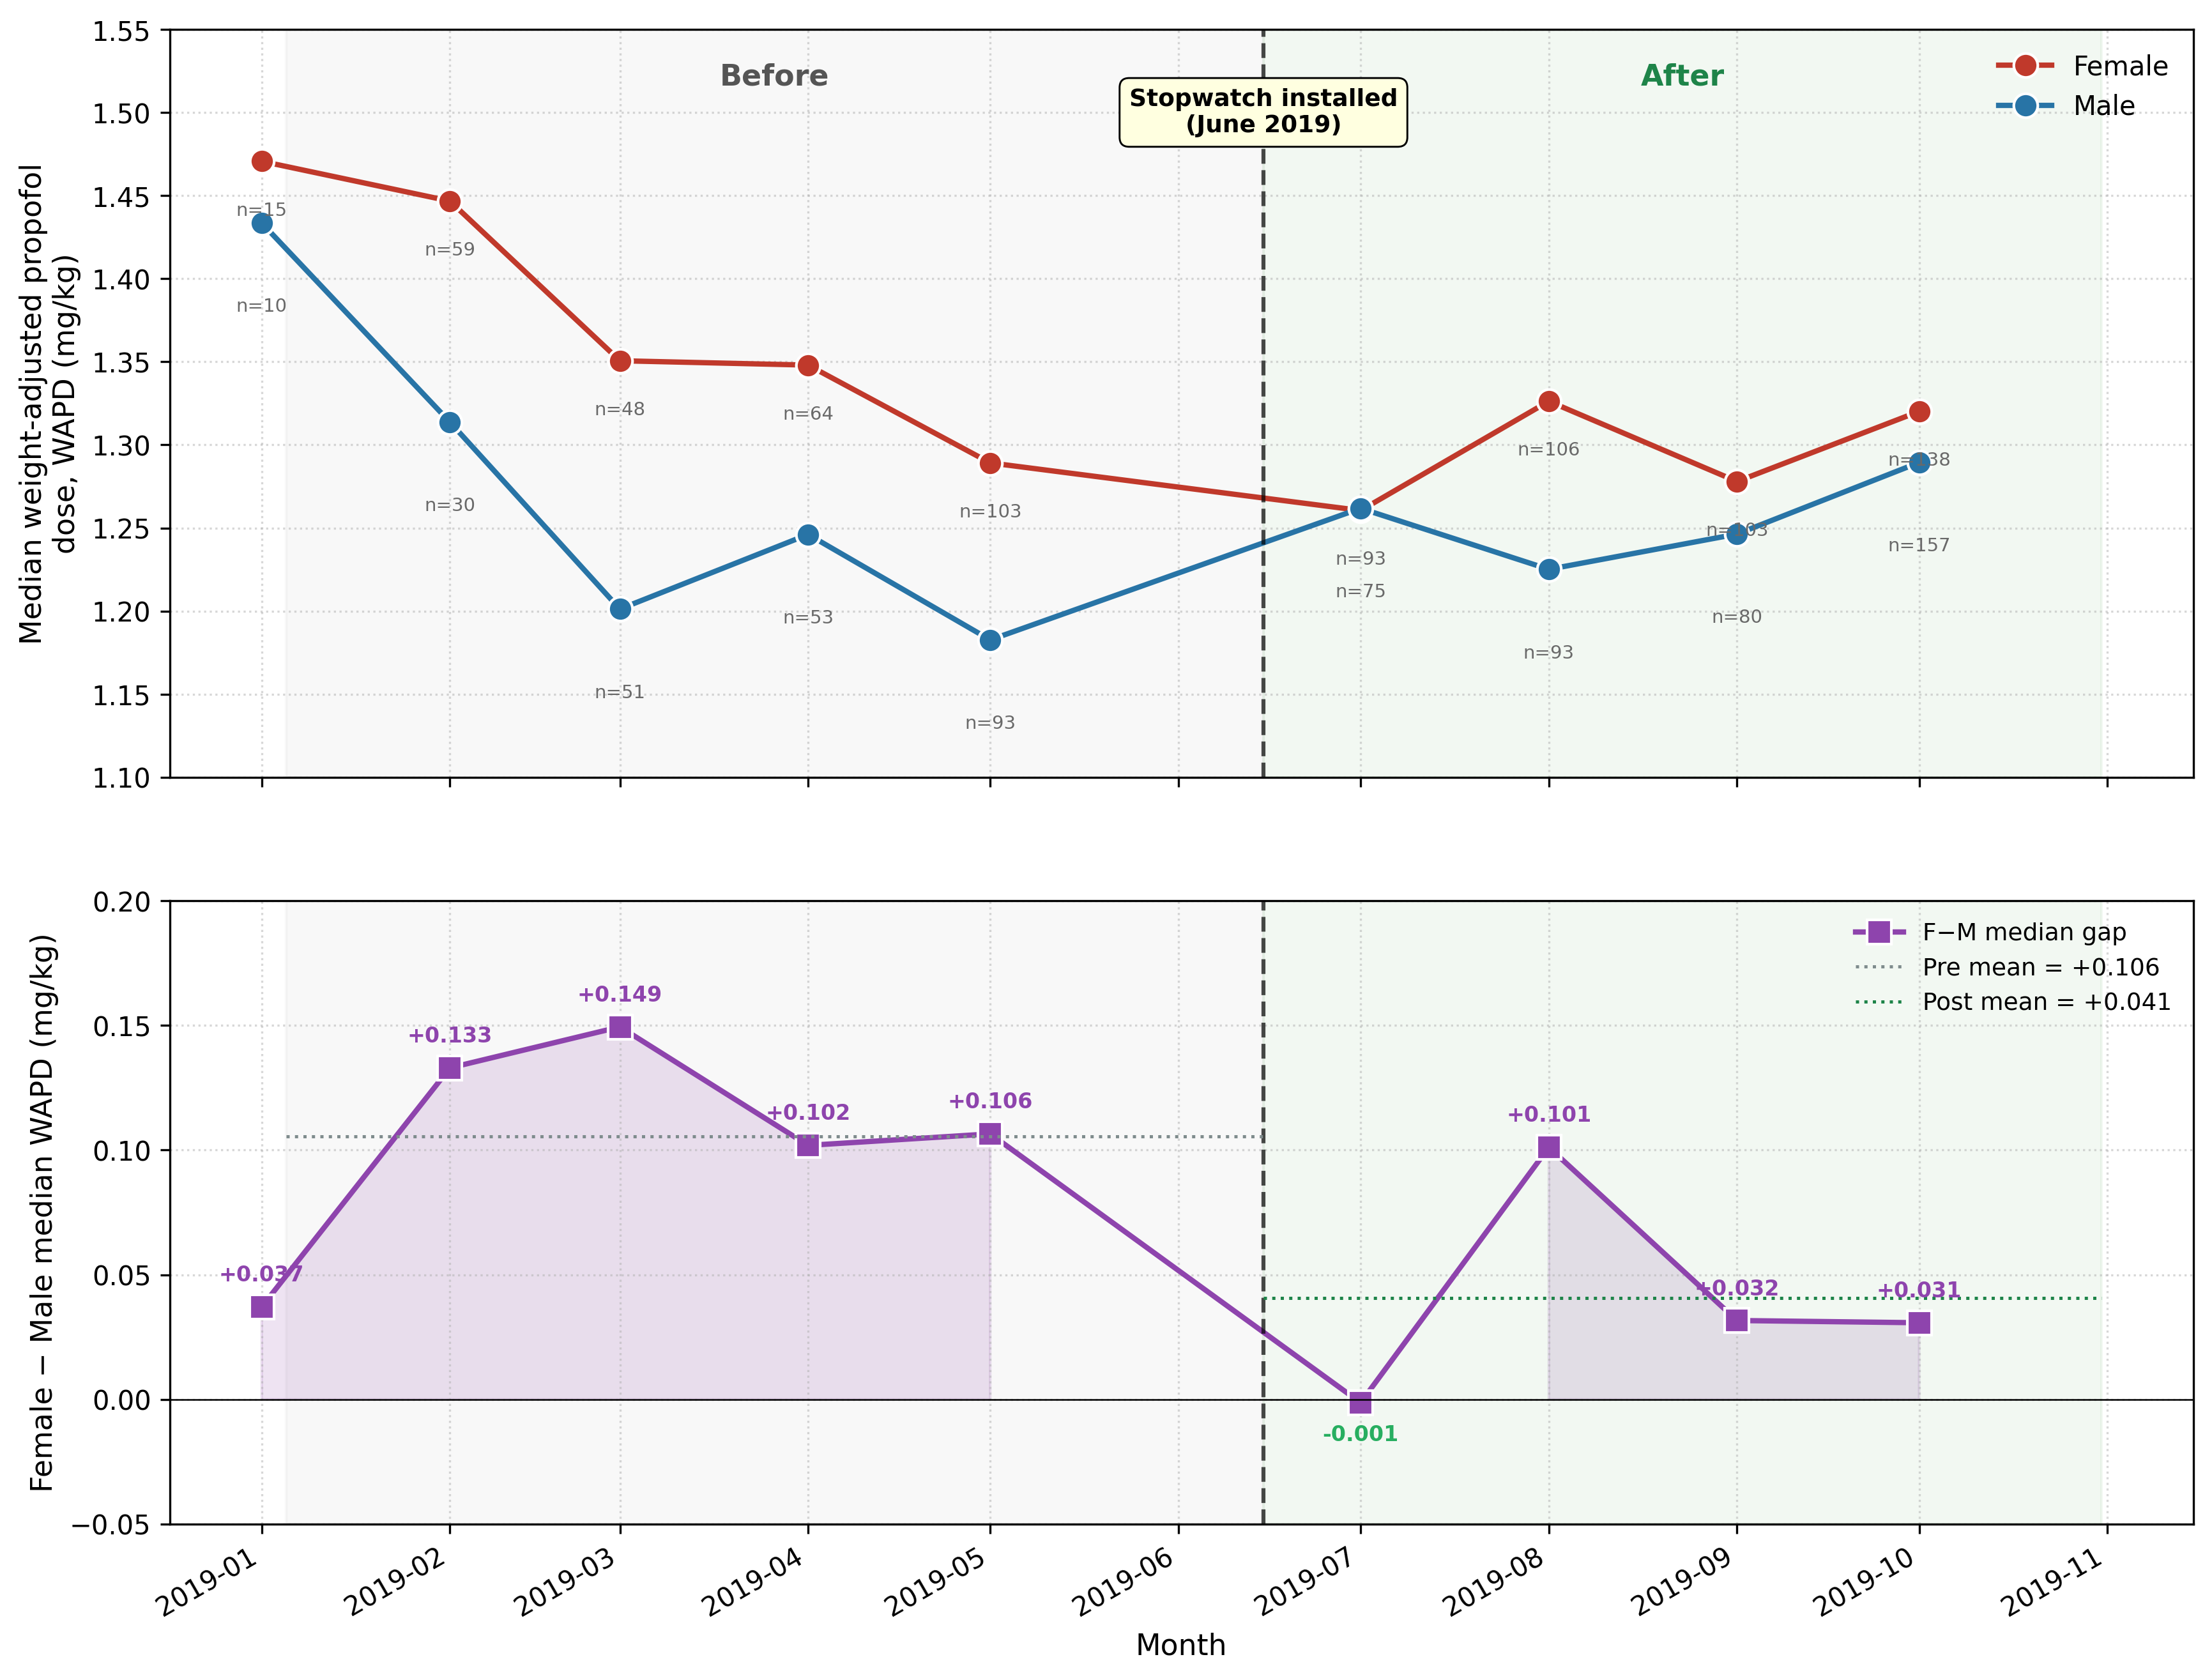
Caption (v8 — simplified).
- Panel A: Monthly median WAPD by sex. Both sexes show a downward trend in absolute levels before the intervention.
- Panel B: Monthly female–male WAPD difference. The difference remained stable in the pre-intervention months and visibly drops at the intervention boundary.
(변경 사항: figure 안 부제목·suptitle 제거 (Before/After 라벨은 panel A 상단에 텍스트로 표시). 색 설명 (Female red; Male blue) caption에서 제거 — figure legend가 색을 표시.)
(시각 코멘트 anchor 영역 — Figure 3 panel A/B에 대한 의견)
Figure 4. BMI substructure of stopwatch-associated dosing change (KSSO 2022 / WHO Asian-Pacific: underweight <18.5, normal 18.5–24.9, obese ≥25)
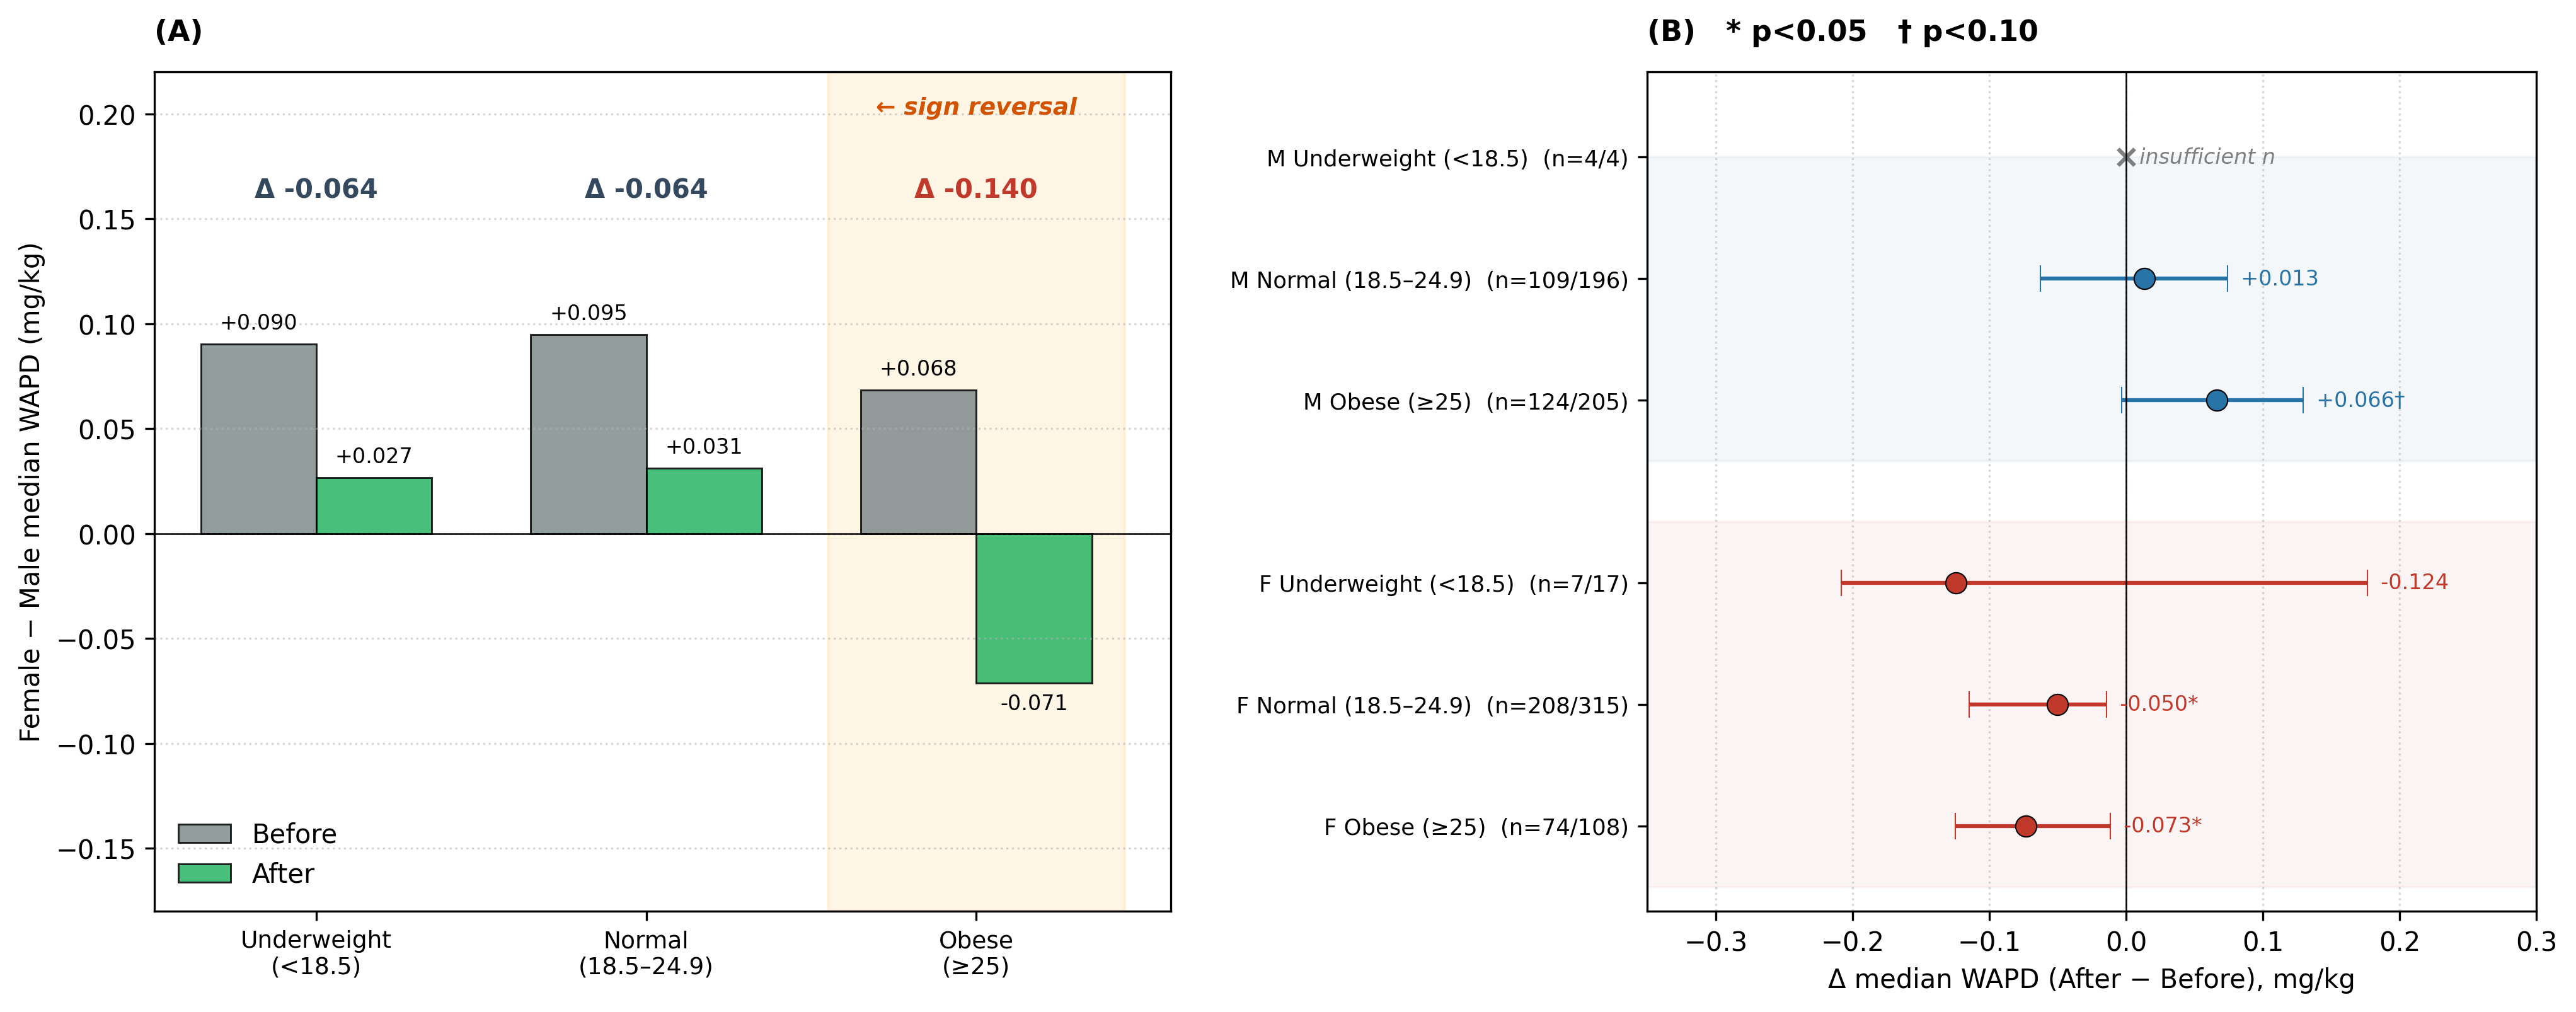
Caption (v8 — simplified, Panel C removed).
- Panel A — Female–male median WAPD difference by BMI category × period. The difference shrinks across all categories; the obese stratum shows the only sign reversal and the largest within-stratum change.
- Panel B — Within-sex change in median WAPD (After − Before) with bootstrap 95% confidence intervals (forest plot). Female normal and female obese cells reach conventional significance; male obese is at trend level; male underweight cell (n = 4/4) marked as “insufficient n”.
(변경 사항: Panel C (median trajectories) 제거 — panel A/B가 충분히 설명한다는 사용자 의견. Panel B y축 라벨이 panel A를 침범하지 않도록 wspace 확대. suptitle 제거.)
(시각 코멘트 anchor 영역 — Figure 4 panel A/B 표현·forest plot 가독성·색에 대한 의견)
Table 1. Patient and procedural characteristics by period (n = 1,371)
| Variable | Before (n = 526) | After (n = 845) | p |
|---|---|---|---|
| Female, n (%) | 289 (54.9%) | 440 (52.1%) | 0.33 |
| Age (years), mean ± SD | 49.3 ± 10.9 | 48.4 ± 10.5 | 0.16 |
| Height (cm), mean ± SD | 163.9 ± 8.8 | 165.1 ± 8.7 | 0.020 |
| Body weight (kg), mean ± SD | 65.4 ± 12.5 | 66.3 ± 13.1 | 0.22 |
| BMI (kg/m²), mean ± SD | 24.2 ± 3.3 | 24.2 ± 3.5 | 0.88 |
| Procedure time (s), median [IQR] | 78 [64; 97] | 74 [62; 91] | <0.001 |
| Total propofol dose (mg), median [IQR] | 80 [80; 100] | 80 [70; 100] | 0.73 |
| Propofol per body weight (mg/kg), median [IQR] | 1.32 [1.15; 1.49] | 1.28 [1.15; 1.45] | 0.14 |
Continuous variables compared by t-test (mean ± SD) or Mann–Whitney test (median [IQR]); categorical by chi-square test. Bold p-values denote p < 0.05.
(변경 사항: title “(analytic cohort, n = 1,371)” → “(n = 1,371)”. mean ± SD 모두 소수점 첫째 자리로 통일.)
(첨삭 anchor 영역 — Table 1)
Table 2. Sex-stratified weight-adjusted propofol dose (n = 1,371)
| Sex | n (Before / After) | Median WAPD Before (mg/kg) | Median WAPD After (mg/kg) | p (within-sex) | Median total dose Before | Median total dose After | p (total dose) |
|---|---|---|---|---|---|---|---|
| Female | 289 / 440 | 1.379 | 1.288 | 0.001 | 80 [70; 80] mg | 70 [70; 80] mg | <10⁻⁵ |
| Male | 237 / 405 | 1.235 | 1.264 | 0.095 | 80 [80; 100] mg | 90 [80; 100] mg | 0.003 |
Median [IQR] reported because WAPD is right-skewed in all four sex × period groups (skewness +0.5–+1.6; Shapiro–Wilk p < 0.01). Within-sex p values use the Mann–Whitney rank-sum test. The proportion of patients at each 10-mg dose level, with two-proportion z-test comparisons between periods, is reported in Supplement Table S0.
(변경 사항: Δ at N mg rows 모두 supplement Table S0으로 이동. “dose-grid changes” 용어 제거. MW p 별도 column으로 분리. n_B/n_A → “n (Before/After)“로 명확화. footnote 정리. WAPD 분포가 right-skewed라 median 유지 — 4 group 모두 Shapiro p<0.01 (사용자 분포 확인 결과).)
(첨삭 anchor 영역 — Table 2)
Table 3 → Supplement Table S-BMI
v8 변경 사항. Table 3 (BMI substructure)은 Figure 4에 시각적으로 표현되므로 본문에서 제거하고 Supplement Table S-BMI로 이동했습니다 (사용자 의견 반영). 6 행 (sex × BMI category, n = 1,371)의 detail은 supplement에서 확인 가능합니다.
라이브: https://ybman.uk/manuscripts/propofol-stopwatch-supplement/
다음 단계
이 페이지의 figure 그림·caption·table에 추가 의견이 있으시면 Hypothes.is로 첨삭해 주십시오. fetcher가 python3 scripts/fetch_annotations.py 한 줄로 가져옵니다.